


Understanding the top UX statistics & trends in the USA is a must for any brand looking to compete properly. User experience is no longer a surface-level design consideration; it directly impacts conversions, retention, and overall business performance.
This guide explores the most relevant top UX statistics & trends in the USA, supported by recent data, and explains how these insights should influence your UX strategy in 2026.
Trying to improve your website UX, but don’t know where to start? Let us help.
Why the Top UX Statistics & Trends in the USA Matter
The top UX statistics & trends in the USA reveal that user experience is directly tied to business performance. UX is no longer subjective; it’s measurable.
For example, 88% of users are less likely to return after a poor experience. That means that a single bad interaction can eliminate future customer lifetime value, not just one conversion.
Additionally, 32% of customers will leave a brand they love after just one bad experience. This highlights how fragile user loyalty is in the U.S. market.
Core Data Behind the Top UX Statistics & Trends in the USA
Several key metrics fully define the top UX statistics & trends in the USA, such as:
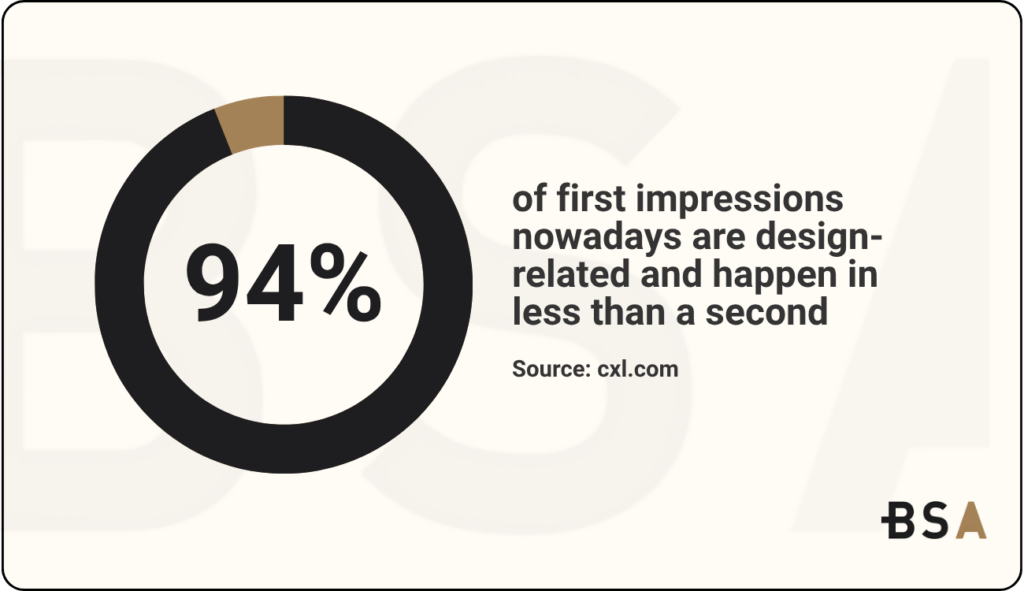
Users now form opinions really fast. 94% of first impressions nowadays are design-related and happen in less than a second. This means your layout, hierarchy, and visual clarity must be exceptional and must communicate trust instantly.
Conversion benchmarks also show the clear importance of a good UX. The average website conversion rate is around 2.9% across all main industries. This means that even small UX improvements can significantly increase conversion gains.
At the same time, attention spans are shrinking. Users now scroll through only about 55% of a webpage on average, which makes content prioritization and above-the-fold design critical.
Speed as a Defining Factor in the Top UX Statistics & Trends in the USA
Speed is one of the most consistent elements within the Top UX Statistics & Trends in the USA, but its role has evolved a bit. It’s no longer just a performance metric; it is a perception driver and a conversion lever.
Data shows that 53% of users abandon a website if it takes longer than 3 seconds to load, which effectively sets a very clear benchmark. Beyond that, even small incremental delays have big consequences. A one-second delay in load time can directly reduce conversion by around 7%, showing how important UX performance is and how tied it is to revenue.
However, what’s important to note in 2026 is the concept of perceived speed. Users do not evaluate performance purely based on technical load time; they evaluate how fast the experience feels. This is why leading brands are investing in progressive loading strategies, skeleton screens, and immediate feedback mechanisms that reduce perceived latency.
Within the top UX statistics and trends in the USA, speed is not only about avoiding abandonment, but it’s also about creating momentum. A fast experience encourages continued interaction, while a slow one introduces hesitation and doubt.
Mobile UX Gaps in the Top UX Statistics & Trends in the USA
Mobile behavior continues to dominate in the USA, yet it remains one of the most under-optimized areas for many organizations.
Despite accounting for roughly 60% of total web traffic, mobile experiences frequently lag behind desktop when it comes to usability and conversion performance. One of the clearest points is that mobile users are ten times more likely to abandon a task if a site is not optimized for mobile use.
This implies that the main issue isn’t the demand itself; it’s the execution.
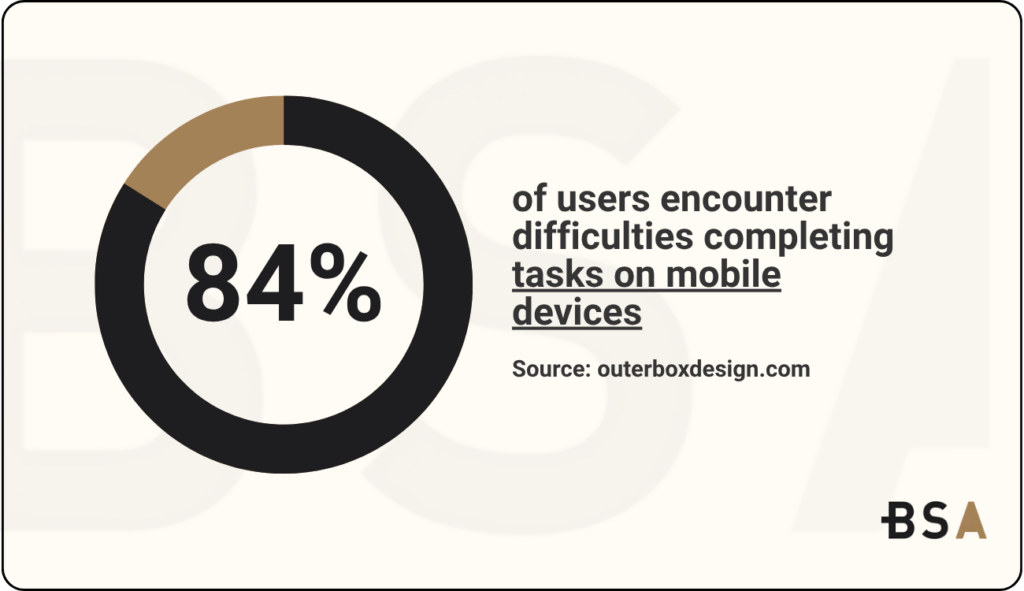
Additionally, studies indicate that 84% of users encounter difficulties completing tasks on mobile devices, which highlights vital UX issues such as poor form design, unclear navigation, and inadequate touch targets.
All of these challenges are compounded by the idea that mobile users are generally multitasking, distracted, or operating under clear time constraints.
It’s clear that mobile UX should be treated as a secondary adaptation of desktop design, but as its own strategic framework. One that prioritizes simplicity, speed, and task completion above anything else.
Explore how we increased Laitek’s organic visitors by 34% with a brand-new SEO strategy in our most recent case study.
UX and Revenue: What Statistics and Trends in the USA Show
One of the most interesting aspects of this year’s statistics and trends in the USA is the direct correlation between UX quality and financial performance.
A well-executed UX design has been shown to increase conversion rates by up to 400%, showing that UX is not just an aesthetic improvement; it’s a growth strategy. Similarly, companies that invest in UX often see their conversion rates double or even triple compared to competitors with less refined experiences.
On the other hand, poor UX introduces friction that instantly impacts revenue. Cart abandonment rates remain high, generally around 70%, and users attribute a significant portion of these drop-offs to UX issues such as complicated checkout flows, unexpected costs, or a lack of trust signals.
Another key insight is that 80% of users are willing to pay more for a better experience. This reframes UX as not just a defensive strategy, but an offensive one.
Personalization Trends in the Top UX Statistics & Trends in the USA
Personalization has quickly become a defining element of statistics and trends in the USA, mainly due to advancements in AI and machine learning.
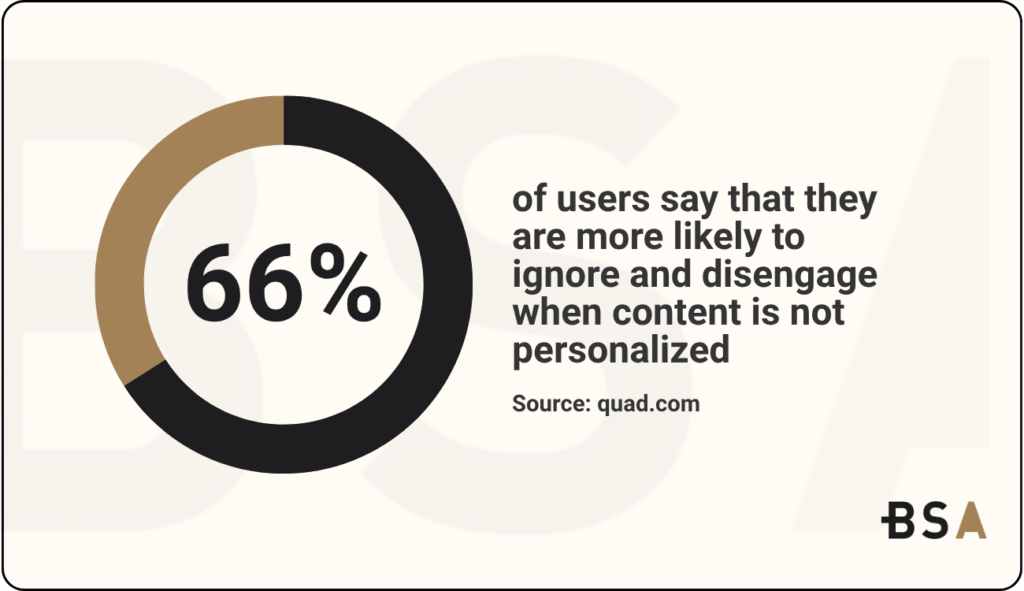
Modern users expect digital experiences to adapt to their preferences and behavior. Around 66% of users say that they are more likely to ignore and disengage when content is not personalized.
This shows the importance of relevance and maintaining user attention, not only at the beginning but throughout their experience on your website.
However, personalization in 2026 goes beyond simple recommendations. It includes dynamic layouts, adaptive navigation, and real-time content prioritization based on user intent.
The challenge is maintaining a delicate balance where personalization enhances engagement while not making usability too complex and abstract in the process. The most effective websites feel intuitive rather than intrusive.
Trust and Credibility Statistics & Trends in the USA
Trust has emerged as a major outcome in statistics and trends in the USA this year, and UX decisions are clearly influencing it as well.
Approximately 75% of users judge a company’s credibility based on its website design alone. This means that visual quality, layout consistency, and attention to detail all play a big role in establishing trust.
Performance also contributes significantly. In 2026, it’s all about signaling reliability and professionalism.
Every single interaction, from page load to form submission, contributes to a user’s perception of trust. Remember, you build trust incrementally and can lose it in an instant if you’re not careful.
Behavioral Friction Trends & Statistics in the USA
One of the least thought-about insights within the top UX statistics and trends in the USA involves fully understanding how users behave when they encounter friction.
Users very rarely articulate their frustrations directly. Instead, they show behaviors such as repeated clicking, rapid navigation, or, in most cases, they will just leave the website altogether. These patterns, often referred to as “rage clicks” or friction signals, provide you with valuable insight into where UX is breaking down.
Research shows that up to 90% of users will stop using an app if the performance is lackluster. This alone shows how quickly frustration leads to disengagement.
The key takeaway from this is that many UX issues are visible at first glance, and it’s why you need to rely on proper analytics. Organizations must focus on behavioral data, such as heatmaps, session recordings, and funnel analysis, to properly identify and resolve any sort of friction points.
Data-Driven UX and Continuous Optimization
The shift toward data-driven decision-making is by far one of the most important developments within the top UX statistics & trends in the USA.
UX is no longer based on assumptions or best practices alone. It’s now guided by real user behavior, measured through analytics and validated through multiple tests. Techniques like A/B testing, usability testing, and behavioral analysis all allow teams to continuously refine their experiences.
This type of approach is a must in any competitive market. Small improvements add up over time and lead to significant gains in performance down the line.
Learn how we increased JSI’s backlink growth by 73% with a new SEO strategy in our latest case study.
Key Takeaways from the Top UX Statistics & Trends in the USA
Both statistics and trends aim for a clear direction: user expectations are increasing while the margin for error is shrinking.
Speed, mobile optimization, simplicity, and trust are no longer differentiators; they are baseline requirements. At the same time, personalization, accessibility, and data-driven optimization are emerging as the next competitive advantages.
Perhaps most importantly, UX is measurable. Every improvement can be tied to real business outcomes, making it one of the most impactful investments a company can make in 2026.
Organizations that prioritize UX strategically will see measurable improvements in conversion rates, customer satisfaction, and long-term loyalty. Those who fail to adapt will risk losing users in seconds.
The opportunity is clear. By aligning your strategy with the top statistics and trends in the USA, you can create experiences that not only meet expectations but also constantly exceed them.
Get a Custom SEO Strategy That Improves Your Conversion with Blacksmith
After going through this list of the most influential UX statistics & trends in the USA, it’s clear that focusing on your UX is a must in 2026. But how are you going to show off your hard work on your website if it’s impossible to find?
Working on your SEO is just as important as working on your website’s UX. But working on a brand new and effective SEO strategy takes a lot of time and effort. From planning to executing, an SEO strategy can take weeks to months to fully implement. This is time you could be using on other aspects of your business, like working on your UX.
So now what?
That’s where we come in. Blacksmith is an SEO Agency with a group of professional digital marketers ready to create the perfect SEO strategy for your business.
Still unsure if a brand-new SEO strategy is what your business needs to grow? Don’t worry, schedule a call with us and we’ll provide you with a full website audit for free. This way, we can show you the areas where a lack of a modern SEO strategy is hurting both your visibility and your conversion rate.


